By ALeahey | July 22, 2014
Hello IASSISTers,
Since our last entry, the Data Visualization Working Group (DVIG) has been connecting through email to gather information and share knowledge about data visualization tools, best practices, teaching, and events of interest. A major theme of conversation has been open source programming frameworks like R statistical packages to conduct visualization. Many other non-programming tools have also been discussed and shared. The question of tools is not an easy one, and there are a lot out there!
For a list of tools (not comprehensive) see: DVIG Tool list (opens in Pearl Trees)
What are we doing with visualization?
Some members are considering licensing software for their institutions, including licensed software such as Tableau (http://www.tableausoftware.com/). Others are considering adding visualization features to existing data repositories or portals, while others are considering these for upcoming data collections and repository development. A discussion about the creation of a blog series related to experiences with different repository software has been mentioned, as well as, a list of criteria for discerning between licensed software and repository systems. Many are concerned about the scalability of tools and are interested in the application of visualization techniques across disciplines and groups.
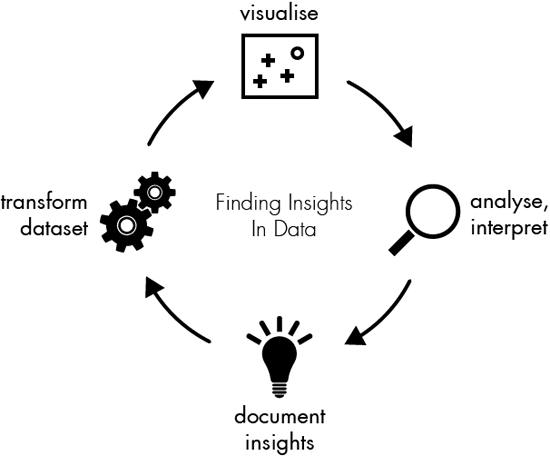
Now, there are a lot of ways to visualize data. The following diagram describes the process of creating and making sense of visualizations, and might be helpful for our discussions and understanding.
Process – Information Workflow

Taken from: Aisch, Gregory. Using Data Visualization to Find Insights in Data. Data Journalism Handbook, Open Knowledge Foundation. http://datajournalismhandbook.org/1.0/en/understanding_data_7.html . 2014-07-11.
Regardless of where we are at, we are all in agreement that data visualization is COOL! And it needs support. Unfortunately the skills needed to perform data visualization and “data wrangling” projects are not taught widely in higher education, however, some institutions have made strides to develop these core skills and training and others are now developing curriculum.
Here is a short list of current courses and teaching materials:
University of Washington, Data Visualization (winter 2014)
New York University, Certificate in Data Visualization
Columbia University, Data Visualization
University of Kansas, Managing Research Data in the Social Sciences (incl data wrangling) (summer 2014)
University of British Columbia, Information Visualization
University of Toronto, Big Data Analytics (fall 2014)
A major theme at this past IASSIST Conference was data support roles. Data visualization topics such as R programming package, developing library support services, teaching tools and undergraduate pedagogy, current research, were very well attended. The IASSIST community is engaged in Data Visualization at almost all stages of the process workflow (see above).
Libraries can play an important role in supporting researchers…
Libraries serve as an ideal place on campus to support visualization for a number of reasons. Data visualization is a truly interdisciplinary activity seeing a growing importance in a wide variety of fields. Even the techniques involved draw on diverse fields from statistics to computer science to design. As such an interdisciplinary field and on that benefits so many diverse fields, visualization has a natural home in the library. Rather than individual disciplines developing support, knowledge and tools for visualization these advances can be shared across campus by making the library a central point of visualization activities.
Furthermore, providing support for data visualization in the library can amplify other data related activities. As libraries increasingly move to collecting, managing and preserving complex datasets offering services that can assist in making sense of that data will make it all the more valuable. Moreover, visualization services provide additional opportunities to inform researchers of support for research and data within libraries.
Data Viz at University of Michigan Libraries
At the University of Michigan we are in the process of developing our services to support visualization. Historically our support for data visualization has developed in two different parts of the library. Both our 3D Lab (part of our Digital Media Commons group) and our Spatial and Numeric Data Services (SAND – Part of the Clark Library for Maps, Government Information and Data Services) have supported and continue to support various types of data visualization, mapping and working with complex types of data. In SAND, where I am located, we focus primarily on helping researchers, students and faculty through consultations where we teach people techniques and how to use appropriate software rather than producing finished products. While we all have our favorite pieces of software we attempt to balance our patron’s familiarity and the most effective software for their goals. We also offer open workshops and course instruction on various data visualization and mapping topics.
While we would ideally like to be able to support the entire spectrum of data visualization activities, one of the most challenging aspects of supporting visualization is providing a scalable service or at least supporting a variety of scales to best benefit one’s campus. Providing consultations around producing graphs and charts for presentations and publications seems easily within the scope and scale of traditional library consultations, but providing production services and assisting with large scale projects such as the creation of interactive web environments or visualizing terabytes of data often requires more time and effort that we usually have to devote to individual projects. Still, libraries, in providing a space for whatever assistance is possible and helping researchers and students understand the resources required for a given project, can offer an invaluable service to our campus communities.
Supported projects at the University of Michigan:
19th Century Acts - http://19thcenturyacts.com/
Mapping Moby Dick - http://record.umich.edu/articles/technology-meets-literature-students-map-classic-novel
Many thanks for all the collaboration on the DVIG list,
Amber Leahey (University of Toronto) & Justin Joque (University of Michigan)

