By Ann | June 1, 2006
The Digital Life Cycle was mentioned many times during the IASSIST 2006 conference. Reaction toward this concept was varied. Some were unsure they liked this idea claiming that the life cycle was a confusing or imperfect metaphor. Others applied a very exact meaning to the concept associating it to the stages through which information passes within a system or large process. The Session that I chaired on Institutional Repositories and Social Science Data: Supporting the Data Life Cycle (B1) provided different visual representations of the digital life cycle. I’m including three diagrams with different takes on the life cycle that together offer an overview of some of the discussion about this concept.
Click on the images to display a larger version.
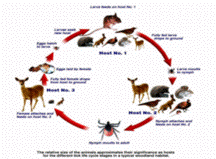
The first diagram is a life cycle model from another discipline and represents the relationship between ticks and their hosts, where hosts play a role in providing supporting environments throughout the life cycle of a particular tick species. As a metaphor, digital objects can be viewed as ticks that are moved from one host to the next where the host serves as the digital object’s environment. Source: EUCALB 1997-2005. European Union Concerted Action on Lyme Borreliosis. Image courtesy of Dr. Jeremy Gray and Bernard Kaye. http://www.oeghmp.at/eucalb/biology_the-tick-life-cycle.html
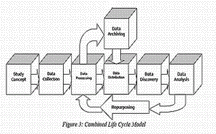
The second diagram provides a representation of Version 3 of the DDI. This version was designed to encompass the life cycle of data with each stage articulating part of the process through which data are generated, transformed, analyzed and re-used. Source: DDI Alliance. “DDI Version 3 Conceptual Model” (draft 2004) http://www.icpsr.umich.edu/DDI/committee-info/Concept-Model-WD.pdf.
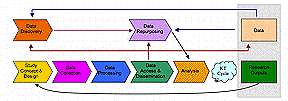
The third life cycle view, articulated by Chuck Humphrey, builds upon the DDI Version 3 model and incorporates a Knowledge Transfer Cycle as a distinct stage within the research cycle. The data life cycle occurs throughout the stages of the research cycle. Source: Humphrey, Charles. “e-Science and the Life Cycle of Research” (2006) http://datalib.library.ualberta.ca/~humphrey/lifecycle-science060308.doc
What is a life cycle and why should we care? First, ’life cycle’ is different from ’life span,’ that is, the time from birth to death. A ‘cycle’ implies an environment in which resources are managed and preserved for discovery and repurposing. Resources are created, curated, made accessible, and preserved for subsequent research, learning, and policy activity. The challenge is to infuse the data life cycle with the metadata and services that will enable access, evaluation and re-use over time. Second, by diagramming different views of life cycles, we have a way of bringing together ideas about the life cycle of research programs with ideas about data resources and processes (capturing, managing and linking data resources). Viewing the full research life cycle allows us to identify gaps in services, technologies and partnerships that could improve the ability to capture and document the output of scholarly research and teaching.
Other diagrams have appeared in:
ICPSR Guide to Social Science Data Preparation and Archiving: Best Practice throughout the Data Life Cycle which offers a view “illustrating key considerations germane to archiving at each step in the data creation process. The actual process may not be as linear as the diagram suggests, but it is important to develop a plan to address the archival considerations that come into play across all stages of the data life cycle.” http://www.icpsr.umich.edu/access/dataprep.pdf
UKDA/ESDS offers a view of the lifecycles of datasets and the projects that create them in Guide to Good Practice: Data Management (2005), p. 8. http://www.esds.ac.uk/support/guides/A4.pdf
Chris Rusbridge of the Digital Curation Centre pulls together a set of life cycle diagrams in: “Information Life Cycle and Curation.” (2005). http://www.dcc.ac.uk/docs/dcc-life-cycle.ppt
Liz Lyon writes about the “concept that research and learning processes are cyclical in nature, and that subsequent outputs which contribute to knowledge, are based on the continuous use and reuse of data and information.” “eBank UK: Building the links between research data, scholarly communication and learning” Ariadne, July 2003. http://www.ariadne.ac.uk/issue36/lyon/intro.html
Contributed by Ann Green


